


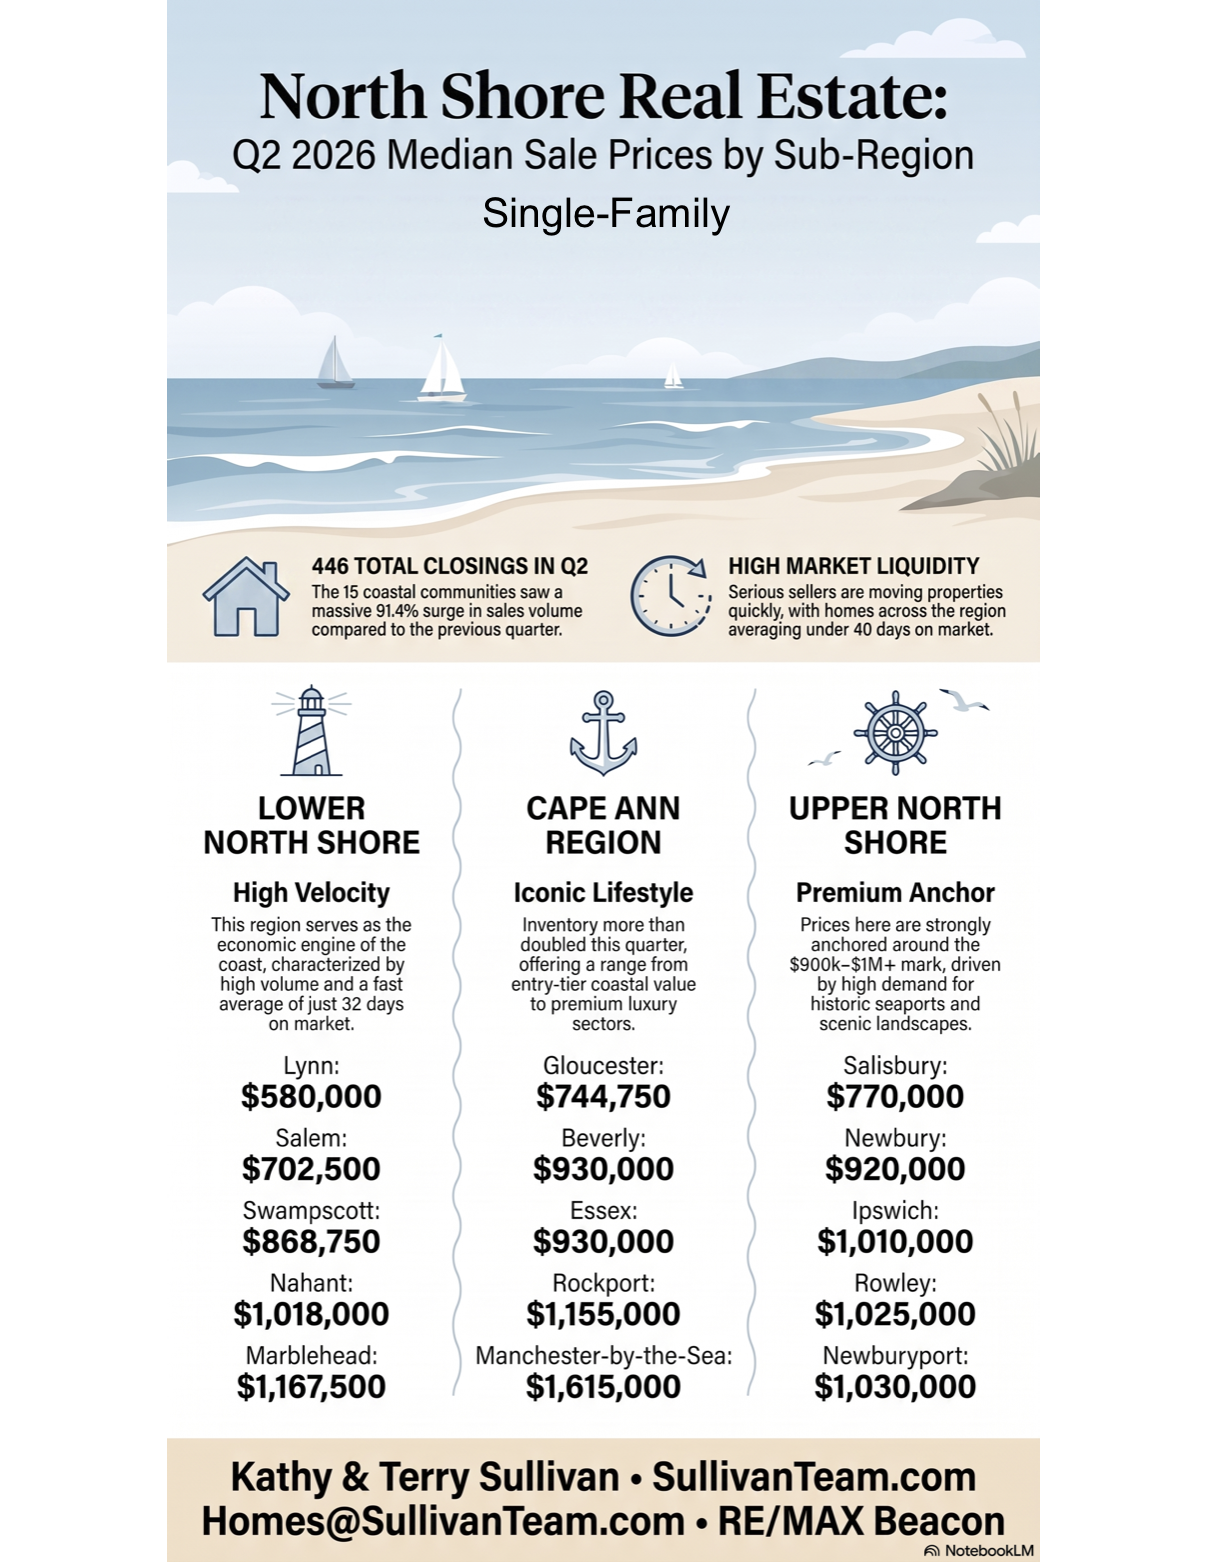
The Macro Picture: Q2 vs Q1 for 15 North Shore Coastal Towns
Home Sales surge 91.4% to 446 units in Q2 vs 233 units in Q1; Median Prices
rose 2.5% to $815,000, and Average Days on Market was 35. Months of Inventory fell from 2.7 months in Q1 to 2.2 Months in Q2. Homes with price Reductions rose from 15.2% in Q1 to 22.6% in Q2.
1. The Lower North Shore:
5 Communities
(Lynn, Nahant, Swampscott, Marblehead, Salem)
Unit Sales Rose 66.9% to 202 Homes in Q2 vs 121 in Q1; Median Prices rose 0.7% to $694,500; Average 35 Days on Market; Town Median Prices Ranged from $580,000 for Lynn to $1,167,500 for Marblehead; Months of Inventory fell to 1.8 Months in Q2 from 2.1 months in Q1.
The Story: This region represents the high-velocity economic engine of the coast.
2. The Cape Ann Region
5 Communities:
(Beverly, Manchester-by-the-Sea, Gloucester, Rockport, Essex)
Unit Sales rose 100% to 128 Homes in Q2 vs 64 in Q1; Median Prices rose 10.4% to $927,500; Average 36 Days on Market; Town Median Prices Ranged from $744,750 for Gloucester to $1,615,000 for Manchester; Months of Inventory fell to 2.4 Months in Q2 from 3.9 months in Q1.
The Story: Demand for the iconic Cape Ann lifestyle remains fierce; Active Listings more than doubled to 326 since Q1.
3. The Upper North Shore
5 Communities:
(Ipswich, Rowley, Newbury, Newburyport, Salisbury)
Unit Sales rose 141.7% to 116 Homes in Q2 vs 48 in Q1; Median Prices rose 11.8% to $950,000; Average 33 Days on Market; Town Median Price Ranged from $770,000 for Salisbury to $1,030,000 for Newburyport; Months of Inventory fell to 2.4 Months in Q2 from 3.9 months in Q1.
The Story: This region is famous for its historic seaports, sprawling salt marshes, and scenic landscapes.
To view data for every Essex County town,
- To view data for every Essex County town, http://www.sullivanteam.com/Properties/Reports/Public/Charts.php
- To Download the full report go to: http://sullivanteam.com/pages/EssexCountyHousingReports